
Understand how your Agents help people and where their time goes. Use logs to follow an individual answer and analytics to review usage, performance, and cost over time.
1. Open the logs
Go to Agents → Logs. Each row represents a turn. Review its time, Agent, model, status, duration, tokens, and cost.

Select an Agent or status, choose a date range, or search the prompt, response, user, or error. The Custom range exposes start and end dates.
2. Narrow the investigation
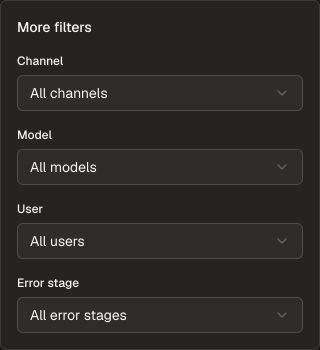
Open More filters for Channel, Model, User, and Error stage. Clear unnecessary filters if you cannot find the turn.
3. Open the turn
Choose a row's trace link. The detail page shows a run summary, conversation, execution timeline, and expandable Technical metadata. Where available, View run opens the associated automation run.
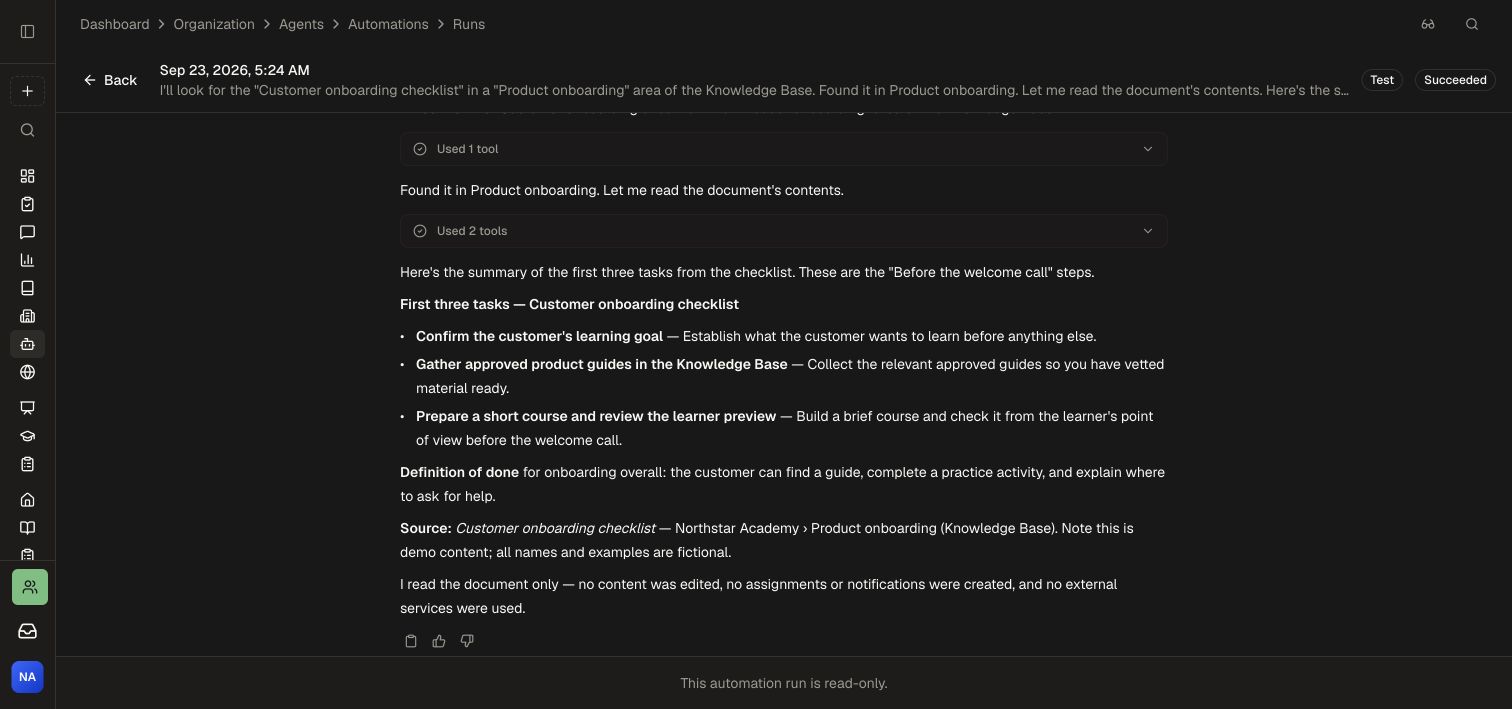
For an automation, open Runs, select Show test runs when needed, and choose a run to read its answer and expand its tool activity. The example below summarizes an approved onboarding checklist and cites the source.
4. Review trends
Open Agents → Analytics. Filter by Agent, status, and date range. The cards summarize Runs, Unique users, Tokens, Cost, Success, and p95 latency. Use Runs, Users, Tokens, Cost, or Failures above the activity chart to change the measure.

Choose View logs to investigate individual turns behind the summary. A new draft Agent with no executions has no turns to inspect yet.
Use the conversation and tool activity to understand the result, then open the referenced document or course to continue your work. Automations explains test runs; Agent access explains which actions a run can attempt.